

This is the second module of Data Exploration.
At the end of Module 2, you should be able to:
- Treat missing values in a data set
- Understand the technique of detecting and treating Outliers
- Understand the concept and need for feature engineering in data exploration
Missing Values
During analysis, it is normal to see missing values contained in a data set which might be a bit frustrating especially when you don’t know the next step to take. Most times missing values occur from the point of data collection to the point of data extraction.
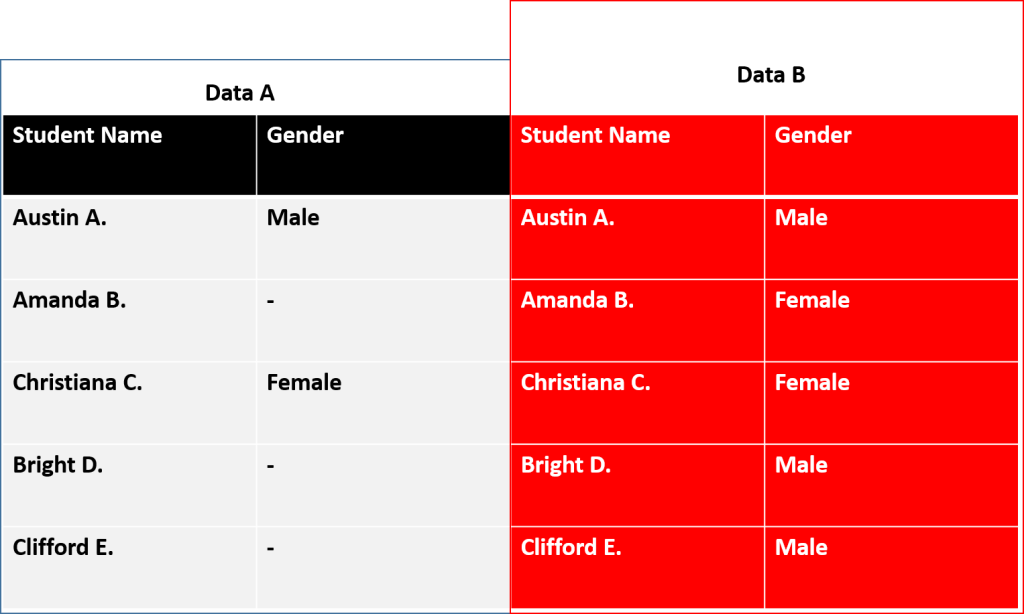
Missing Values are data values not contained in a given data set which could be a useful point in making strategic decisions. If not treated properly, it can skew insight, increase the rate of bias in a dataset and can lead to misleading recommendations. An example is the Student Data below showing “Data A” with missing data fields and whose results after analysis gives a total of “one(1) male student” and “one(1) female student“. However, after a proper data cleansing was done, we were able to achieve “Data B” showing complete data records with results as Two(2) females and Three male(3) students.
How to treat Missing Values
There are different ways used to solve missing values. They include;
- Deletion: Dropping the data value/observation containing the missing value
- Imputing a value: There are various ways of inputting a value depending on the data set. They include using Mean/ Mode/ Median Imputation, KNN(K-Nearest Neighbors)
- Randomly imputing a value: This reruns the analysis for all possible responses, the subject might have given to the question, weighted based probability.
Outliers
An outlier is a person or thing differing from all other members of a particular group or set based on its characteristics and other obvious differences.
In statistics, an outlier is a data point that differs significantly from other observations. Outliers in a data set can increase bias levels in a given data set.
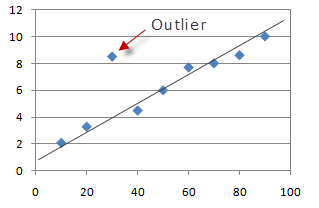
The most common method to detect outliers is visualization An example of an outlier is shown below indicated with an arrow as all data points follow a linear curve BUT not the outlier;
Other methods of detecting outliers includes capping methods where any value capped out of range of 5th and 95th percentile is considered an outlier.
Causes of Outlier
- Human Error caused during data entry
- Data processing errors due to activities in the extraction of data
- Data Measurement Issues
- Valid Outlier: When a data segment with an outlier is confirmed to be true.
How to treat Outliers
Deletion: If the outlier value was as a result of data entry and data processing errors.
Log Transformation: The log transformation can be used to make highly skewed data less skewed, reducing outliers in the data set. The comparison of the means of log-transformed data is actually a comparison of geometric mean. Assigning weights and Decision Tree algorithm are also methods used for eliminating outliers.
Imputing a value: Just as highlighted for missing values, we can also input values on outliers using Mean/ Mode/ Median Imputation, KNN(K-Nearest Neighbors)
Treat separately: For Valid outliers, it is advisable to treat them separately especially if they are of significant values, We can apply a segmentation analysis to deep-dive further and generate hidden insights.
Feature Engineering?
What is Feature Engineering?
“Feature” simple means a distinctive attribute or characteristics or aspect of something.
Feature engineering in the field of data is the science and the art of extracting more information from existing data.
A scenario is the Sample Supermarket store data where your goal as an analyst is to understand the relationship between age range of individuals who buy a specific product type. In this scenario, using the date format for age contained in this data set, it might be impossible to segment customer’s age by segment hence the need for a variable/feature creation.
The example illustrated below highlights how we used the Variable/Feature engineering to generate new variables/feature based on the existing data sets we have. First, we converted the date of birth column from its current date formats to numeric to enable us gather information on the age group buying specific products.

What is the process of Feature Engineering ?
Feature Engineering can be achieved after the Two(2) Steps of the general Data Exploration is achieved. We will be discussing more on the application of feature engineering in the advanced levels. However, for this course, you should be able to apply simple Feature engineering steps on sample data sets where applicable.
Feature Engineering Steps can be divided in two(2) steps:
- Variable transformation: This is done by replacing a variable by a function of that variable: An example is replacing a variable x by the square root of x or the logarithm of x
- Variable / Feature creation: This is achieved by generating a new variables / features based on existing variable(s) . An example is replacing date of birth from 1/12/2010 to the year count of birth at 19.
Review Questions
Discuss in detail and in your own words: Missing Values, Outlier, Feature Engineering.


